Kathryn McLellan is a qualitative social scientist living in Chicago with her husband and plants.
She once had a $50.45 library fine.
Despite not speaking Spanish nor having ever taken an econ class, she is an expert on Chilean economics.
Did you know that the official term for people who make hooked rugs is hookers?

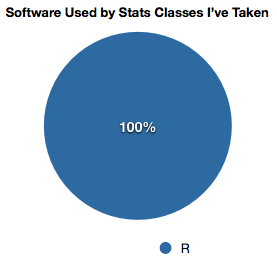
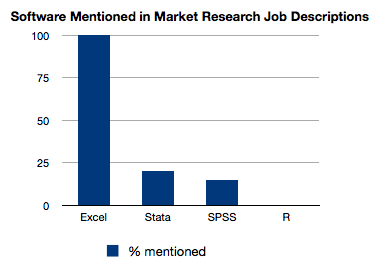

My classes were 100% SPSS, but the job description distribution seems right.
I think they use R because it’s a) free; and b) super geeky (all of my stats classes are through the math dept and not a social science dept).